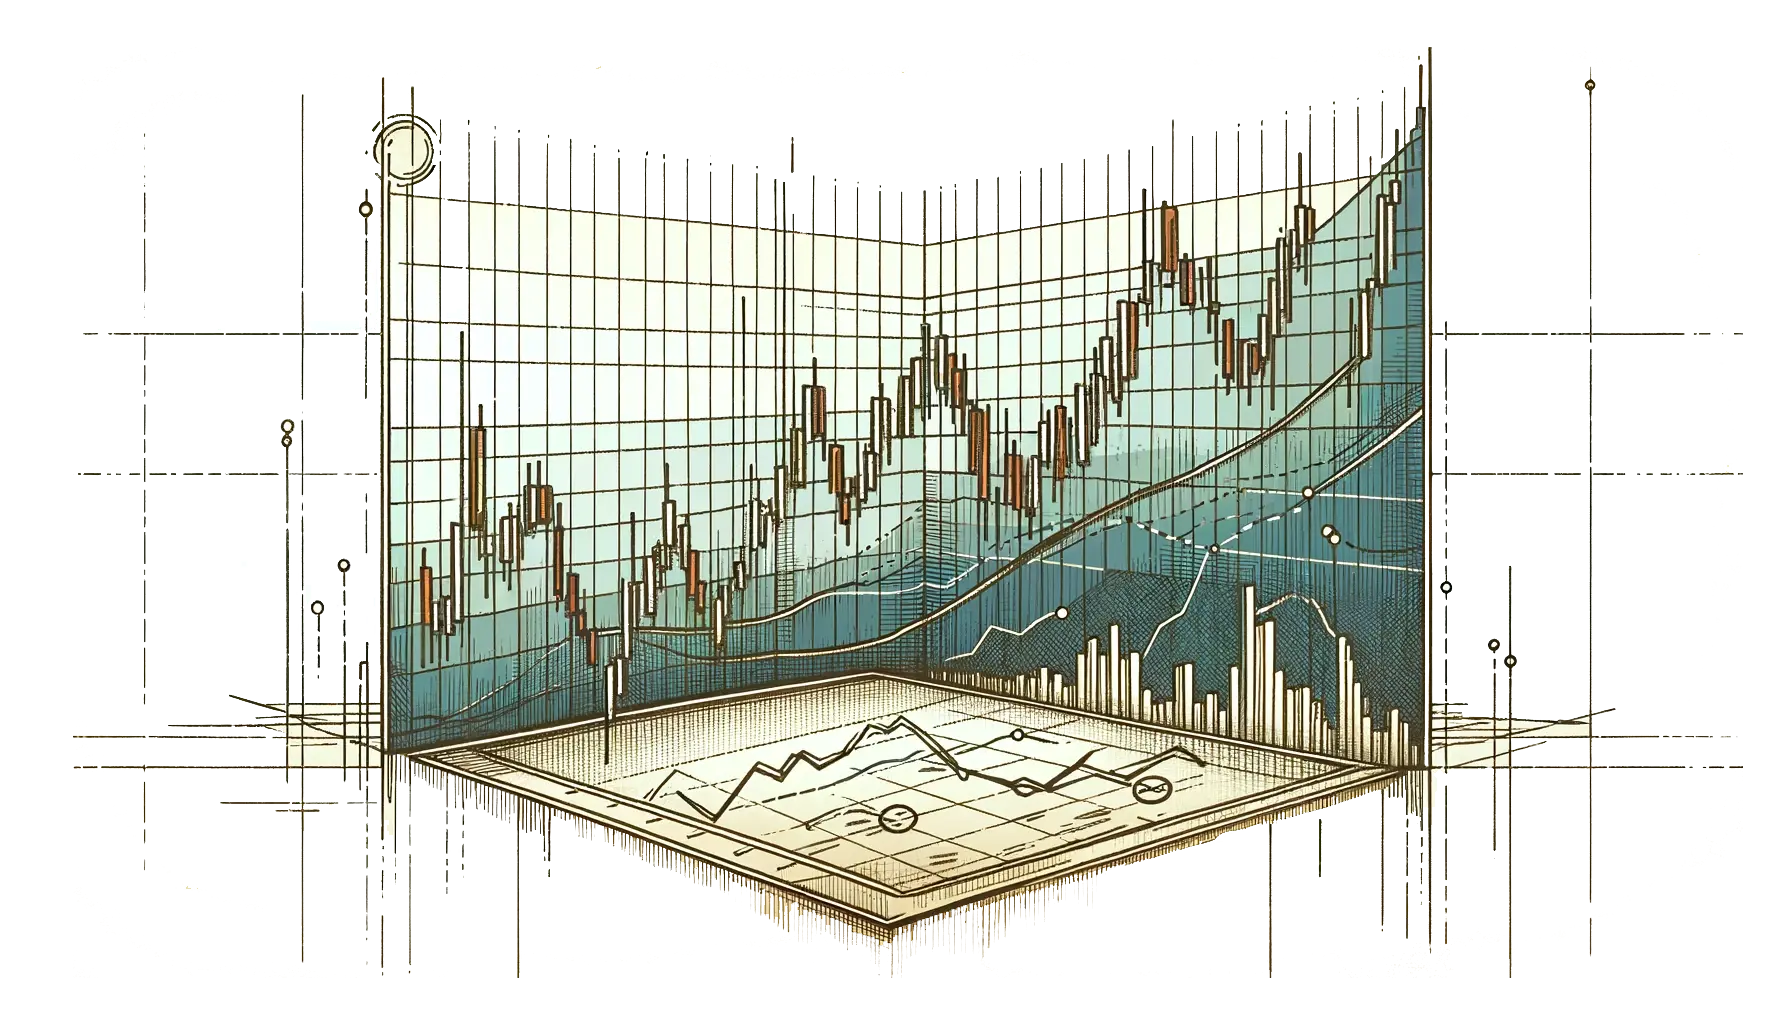
Technical analysis is an essential tool for traders and investors, offering a way to interpret market movements and make informed decisions. Unlike fundamental analysis, which delves into financial statements and economic indicators, technical analysis focuses solely on price movements and trading volumes. This method is based on the idea that historical trading activity and price changes can be valuable indicators of a security’s future price movements.
The Foundation of Technical Analysis
At its core, technical analysis involves studying past market data, primarily price and volume. The underlying principle is that market participants often act in a predictable manner, and their collective behavior leaves patterns in the market data. By identifying these patterns, traders can make educated guesses about future market movements.
Price Charts: The Technical Analyst’s Map
Price charts are the most crucial tools in technical analysis. They provide a visual representation of a security’s price movements over a period. These charts help traders identify trends, patterns, and market sentiment, serving as a roadmap for navigating the markets.
Technical Indicators and Patterns
Technical analysis is rich with indicators and patterns. These include moving averages, Relative Strength Index (RSI), and Bollinger Bands, among others. Each indicator serves a specific purpose, such as identifying overbought or oversold conditions, or signaling potential reversals in the market trend.
The Psychology Behind the Charts
An often-overlooked aspect of technical analysis is the psychology underlying the price movements. Market psychology plays a crucial role in shaping trends and patterns. By understanding the emotions driving market participants’ decisions, traders can better anticipate future market movements.
Reading and Interpreting Charts
Understanding and interpreting charts is a fundamental skill in technical analysis. Charts are not just mere representations of price movements; they are a window into the market’s soul, offering insights into the collective mindset of market participants.
Types of Charts
Line Charts
Line charts are the simplest form, representing the closing prices of securities over time. They provide a clear view of a security’s overall trend and are particularly useful for identifying broader market movements.
Bar and Candlestick Charts
Bar and candlestick charts offer more detailed information, showing the opening, high, low, and closing prices (OHLC) for each period. Candlestick charts, with their distinct color-coded ‘bodies’ and ‘wicks,’ are especially popular as they vividly depict market sentiment and potential reversals.
Chart Patterns
Chart patterns play a crucial role in technical analysis. Patterns like head and shoulders, double tops and bottoms, and triangles can signal continuations or reversals in the market trend. Recognizing these patterns helps traders anticipate potential price movements.
Trend Lines
Trend lines are drawn to connect highs or lows, forming a visual representation of support and resistance levels. These lines can indicate whether a security is trending upwards, downwards, or sideways.
Volume and Price Analysis
Volume, the number of shares or contracts traded in a security or market during a given period, is a significant factor in chart analysis. An increase in volume typically accompanies significant price movements, either up or down, and can confirm the strength of a trend.
Moving Averages
Moving averages smooth out price data to identify the direction of the trend. Simple Moving Averages (SMA) and Exponential Moving Averages (EMA) are widely used to determine support and resistance levels and to identify potential entry and exit points.
Introduction to Trends, Support, and Resistance
Trends, support, and resistance are foundational concepts in technical analysis. Understanding these elements is crucial for predicting future market movements and making strategic trading decisions.
Understanding Trends
A trend refers to the general direction in which a market or a security’s price is moving. There are three primary types of trends:
- Uptrends: Characterized by higher highs and higher lows, indicating a bullish market sentiment.
- Downtrends: Marked by lower highs and lower lows, signaling bearish sentiment.
- Sideways/Horizontal Trends: Occur when there is little movement up or down in the price, indicating a consolidation phase.
Recognizing the type of trend is key to understanding market dynamics and planning trades accordingly.
Support and Resistance Levels
- Support: A price level where a downtrend can be expected to pause due to a concentration of demand. Essentially, support is where the price tends to find a ‘floor.’
- Resistance: A price level where a trend can pause or reverse due to a concentration of selling interest. In other words, resistance is where the price tends to find a ‘ceiling.’
These levels are pivotal in identifying potential entry and exit points in trading.
Trend Lines, Channels, and Patterns
- Trend Lines: Straight lines drawn on charts that connect a series of highs or lows. These lines can help in identifying the trend’s direction and strength.
- Channels: Formed by drawing parallel lines at the same angle as the trend lines. They can indicate potential areas of support and resistance within a trend.
- Patterns within Trends: Within trends, various patterns such as triangles, flags, and wedges can form, offering further insights and trading opportunities.
The Role of Timeframes
Different timeframes can show varying trends and levels, making it essential for traders to consider multiple timeframes in their analysis. This approach offers a more comprehensive view of the market and helps in validating trends and levels across different periods.
